
How to Read Your Baby's Growth Chart (Percentiles Explained)
On this page
You've just left the pediatrician's office and heard something like: "Your baby is at the 35th percentile for weight." Is that good? Bad? Should you worry? Here's what growth chart percentiles actually mean, how to read them, and when a number truly matters.
What Is a Baby Growth Chart?
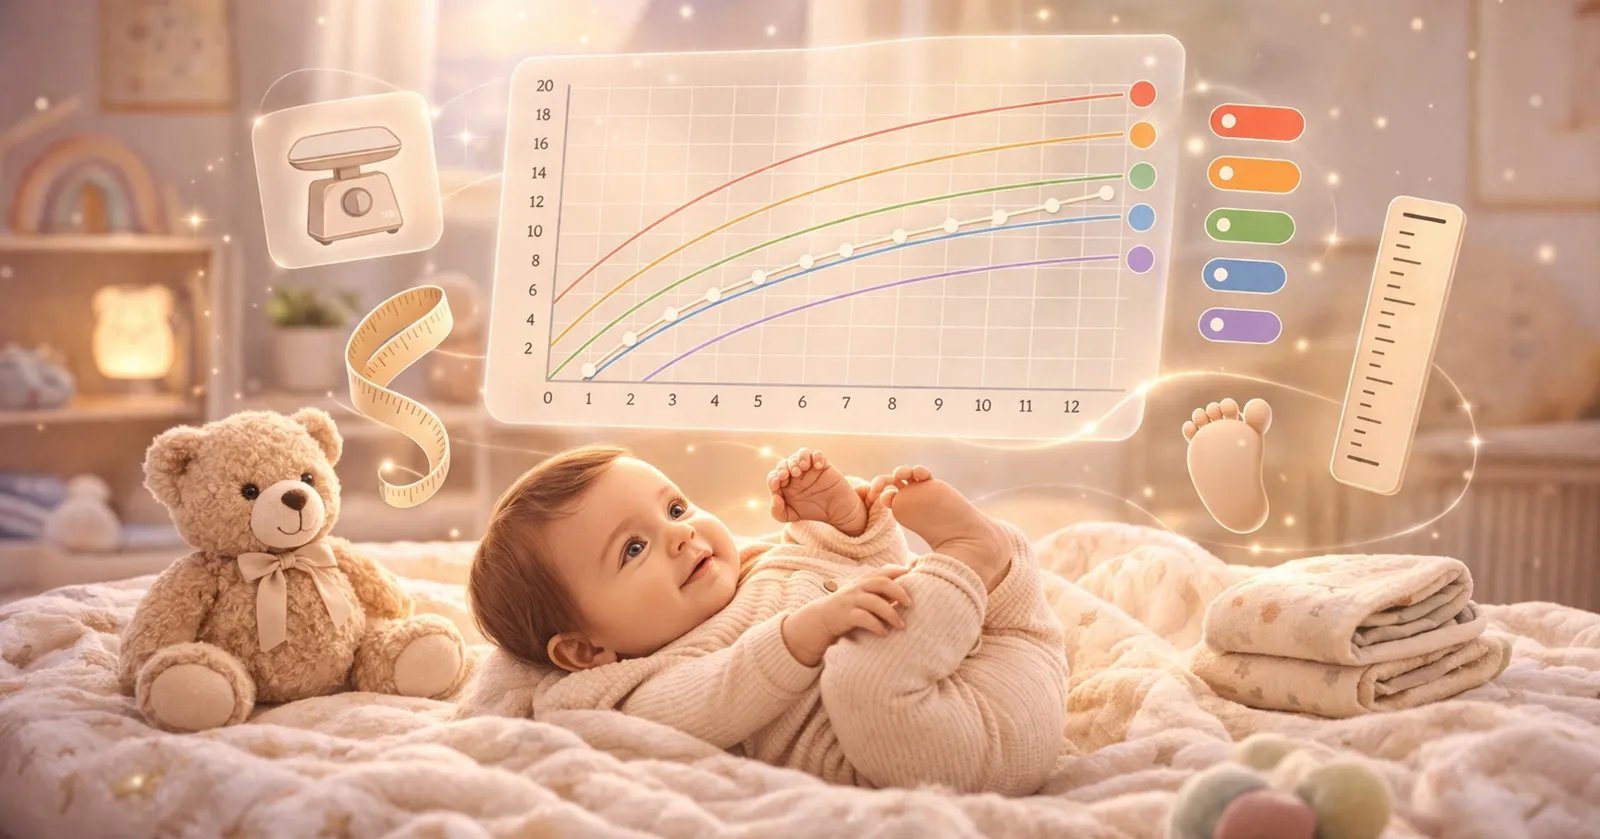
A growth chart is a graph that plots your baby's weight or length against a reference population of healthy children of the same age and sex. The curved lines on the chart represent percentiles — each line shows where a certain percentage of children fall.
The WHO Child Growth Standards were developed from a study of 8,440 healthy, breastfed children across six countries — Brazil, Ghana, India, Norway, Oman, and the United States.
These charts are the global standard for children from birth to 5 years. Your pediatrician uses them at every well-child visit.
What Do Percentiles Mean?
A percentile tells you how your baby compares to other healthy babies of the same age and sex. If your baby is at the 40th percentile for weight, it means:
- 40% of healthy babies weigh less
- 60% of healthy babies weigh more
Important: a percentile is not a grade. Being at the 20th percentile is not "failing" and being at the 90th is not "winning." What matters is consistency — your baby following their own curve over time.
| Percentile Range | What It Means |
|---|---|
| 3rd–15th | Lower end of normal — healthy if consistent |
| 15th–85th | Middle range — where most babies fall |
| 85th–97th | Higher end of normal — healthy if consistent |
| Below 3rd or above 97th | May warrant closer monitoring |
What's the Difference Between WHO and CDC Growth Charts?
This causes a lot of confusion. Here's the simple version:
The CDC recommends using WHO growth charts for children under 2 years of age and CDC charts for children aged 2 to 20 years.
WHO charts (2006) describe how children should grow under optimal conditions — breastfed, healthy, well-nourished. They are a prescriptive standard.
CDC charts (2000) describe how American children actually grew based on historical survey data. They are a descriptive reference.
For babies under 2, both the CDC and the WHO recommend using the WHO standards. Babylitics uses WHO charts for all weight and length tracking.
When Should I Worry About My Baby's Percentile?
A single percentile number at one point in time tells you very little. What matters is the trend over multiple measurements. Watch for these red flags:
- Crossing two or more percentile lines in either direction over a few months
- Falling below the 3rd percentile for weight or length
- A sudden plateau or drop in an otherwise steady curve
- Weight and length diverging significantly (e.g., weight dropping while length stays the same)
The AAP recommends weight checks at each well-child visit — typically at 1, 2, 4, 6, 9, 12, 15, 18, and 24 months of age.
One measurement that looks off is rarely cause for alarm. Two or three in a row that show the same trend is worth discussing with your pediatrician.
How Often Should I Measure My Baby?
For weight, the AAP recommends measurements at each well-child visit. Between visits, weekly or biweekly weigh-ins are sufficient. Daily weighing can cause unnecessary anxiety because normal fluctuations in hydration and feeding can swing the number day to day.
For length, measurements are less frequent — typically at well-child visits only, since accurately measuring a squirming baby at home is difficult.
How Does Babylitics Help Me Track Growth?
Babylitics plots every measurement you log directly on the WHO percentile curves. You'll see:
- Your baby's data points connected as a line on the growth chart
- WHO percentile bands from the 3rd to the 97th percentile
- The median line (50th percentile) for reference
- Growth velocity — how fast your baby is gaining weight or length over time
- Gender-specific charts — WHO standards differ for boys and girls
You don't need to calculate anything. Log a measurement and see exactly where your baby stands — the same view your pediatrician uses, available on your phone anytime.
Frequently Asked Questions
Plot your baby's weight and length against WHO growth curves — free for 15 days, no credit card required.